Creating 3-D Functions
|
|
|
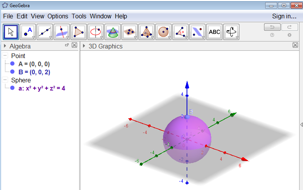
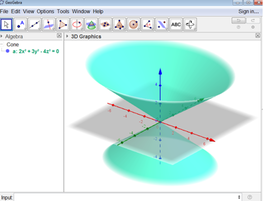
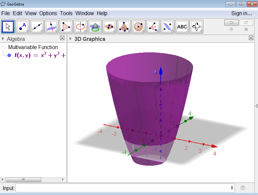
This project was created to demonstrate how to use GeoGebra to graph 3-dimensional functions. Functions with multiple variables require us to use a three-dimensional coordinate system in order to graph them. We look at these functions on the (x,y,z) set of axes. These functions can often be difficult to visualize on our two-dimensional papers. Although we can sketch them on paper, it is difficult to manipulate them to see the full scope of the function. Programs like GeoGebra, allow us to easily graph three-dimensional functions and manipulate them, so that we gain a solid understanding of what that function looks like.
This technology project was very interesting to me. Using GeoGebra to look at the 3-D functions allows students to manipulate the different variables to get a better understanding of what each variable changes on the graph. In a classroom, I would do this activity with a class set of laptops or ChromeBooks so that the students can follow along as I instruct, and explore on their own.
My worksheet can be found here.